Stepping into chained method calls with XDebug and PHPStorm
Or Shift F7 where have you been all my life?
More and more frameworks are providing API's that are chainable. It's descriptive, concise and the in thing.
So, instead of code like this:
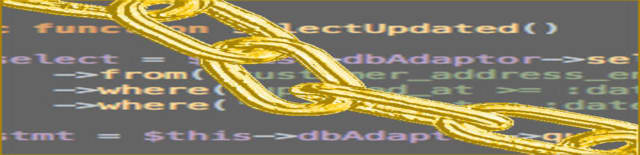
$select = $dbAdapter->getSelect();

$select->columns(['id', 'name', 'email']);
$select->where('is_active=1');
$select->where('id > 1000');
$select->order('id DESC');
$select->limit(1);
We have this:
$select = $dbAdapter->getSelect()
    ->columns(['id', 'name', 'email'])
    ->where('is_active=1')
    ->where('id > 1000')
    ->order('id DESC')
    ->limit(1)
Much less clutter, and easy to implement. To make this coding style work all these chainable methods need to return their instance value:
public function columns(array $columns)
{
    // ... do stuff with $columns
    return $this;
}

public function where($where)
{
    // ... do stuff with $where
    return $this;
}

// .. etc
But upto now I've had a big problem with this syntax. Not with the implementation or appearance but using xdebug breakpoints.
Say I have problems with the 'order' method that I want to investigate with XDebug and PHPStorm. With the chainable syntax how do we get there?
Set a breakpoint for the line '$select = $dbAdapter->getSelect()' and then use 'Step into'.
This steps into the 'getSelect' method. Not what we want. So we step over till the end of that method and step over again which lands us in the 'columns' method. It's tempting to use step out while in the 'getSelect' method, but that gets us out of the whole chain so we miss everything. Still we are in 'columns' now. Not what we want, but closer!
So again repeat this method till we land in the 'order' method. Then the debugging can be done. We could of course have put the breakpoint in the 'order' method in the first place but this assumes we know what object 'getSelect' is going to return. And with big frameworks and modular architectures this is not always obvious.
So this drove me crazy. I just wanted to be able to highlight the method to step into or choose it from a list or something.
And that's what PHPStorm gives you, I just didn't know where to find it. I'd always been looking at options in the debugging panel. It would be with 'step over' and 'step into' buttons right? Wrong!
It's in the top 'Run' menu.
And I never go in any of the top menus. Ever. Well except for creating new projects.
Since PHPStorm gives me contexual menus, panel buttons and keyboard shortcuts galore I'd never though to look in the top menus.
And there it is:
Smart step into

This give's exactly what's required. A popup menu allowing you to choose which method to step into.
And a keyboard shortcut to commit to muscle memory.
So thanks again PHPStorm but please add a 'smart step into' button on the debug panel so it's easier for me to find!